
Software Development Nuggets for Security Analysts Part 2: The Browser

The response to the first article was really positive, and it highlighted something I've seen a lot: many of us in security come from backgrounds in IT, networking, or other fields that aren't pure software development. It creates a need to bridge the gap between what developers do and what we analyze.
In that first post, we went over some core concepts that can feel a bit hazy if you haven't been on a dev team. We looked at how developers use OS directory structures, what the numbers in a version like 1.3.7 actually mean (Semantic Versioning)[1], and the role of environment variables and shared libraries, including the often-abused DLLs.
If you missed it or just want a refresher, you can find the original post here:
Software Development Nuggets for Security Analysts
For this post, we're moving up the stack from the OS and into the web browser. It's a tool we use all day, but the way it actually executes code is often a blind spot for analysts. We're going to break down how the browser functions as its own self-contained world for running the modern web.
JavaScript's World: The Browser as an OS
The most important concept to grasp about modern websites is this: the JavaScript code you interact with runs on your machine, inside your browser, not on the company's server[2]. For all practical purposes, the browser acts as a miniature, sandboxed operating system for that script. It gives the code the tools it needs to run while keeping it safely walled off from your actual computer[2:1].
This separation is a critical security feature. If a script on any website could freely read your local files or open network connections, it would be chaos[2:2]. So, the browser acts as a strict gatekeeper. The script lives in a "sandbox" and has to ask the browser for permission to do almost anything, like making a network call or saving data.
Note: While JavaScript typically runs sandboxed in the browser, attackers can abuse server-side JavaScript environments like Node.js or leverage system utilities that include a JavaScript engine, sometimes referred to as LOLBINS (Living Off the Land Binaries), to execute malicious code outside the browser's protections.
Talking to the Outside World: HTTP Requests
So how does a script running in the browser talk to a server? It acts as what developers call an API consumer. The script itself is just the front-end; its main job is to manage the user interface. All the real data and the core business logic live on a separate back-end server, which might be written in anything from Node.js to Python or Java[3].
To do anything useful, like fetching your account info or submitting a form, the front-end script has to communicate with the back-end over the network. It does this by asking the browser to send an HTTP request to a specific web address, or API endpoint.
For years, the standard tool for this was XMLHttpRequest (XHR)[4]. You'll still see it in older code, but it's known for being a bit clunky. The modern replacement is the Fetch API, which does the same job in a much cleaner and more efficient way[5]. Regardless of the tool, the process is the same: the JavaScript code builds a request and hands it to the browser. The browser sends it out, gets the response, and passes it back to the script.
The Performance Hierarchy: Memory, Disk, and the Network
Why do developers go through all this trouble to run code and store data inside the browser? Why not just have the server do everything? The answer comes down to a core concept in all of computing: performance cost.
Not all operations are created equal. In computing, every action has a time cost, and developers are obsessed with keeping that cost as low as possible. A simple way to think about this hierarchy is to compare it to getting a piece of information yourself[6].
- Memory (RAM): This is like remembering something you already know. Access is nearly instantaneous. When an application has data loaded into active memory (RAM), it's the fastest way to get it. This is the "cheapest" operation, with access times measured in nanoseconds[6:1].
- Disk (SSD/HDD): This is like grabbing a book off a shelf right next to you. It's fast, but it's orders of magnitude slower than just thinking about something. A disk seek takes around 10,000,000 nanoseconds (10 milliseconds)[6:2]. This is equivalent to your computer reading a file from its local solid-state drive or hard disk.
- Network: This is like calling a friend and asking them to look something up for you. There's a huge delay. A round trip within the same datacenter can take 500,000 nanoseconds, and a trip from California to the Netherlands and back can take 150,000,000 nanoseconds[6:3]. This is by far the "most expensive" operation, and it's exactly what happens every time the browser makes an API call to a back-end server.
Why This Matters for an Analyst
This performance hierarchy is the secret decoder ring for understanding modern web application architecture. Developers will almost always choose the "cheapest" option available to give the user the fastest experience and to reduce the load on their own servers.
This explains why applications do what they do.
- Why does a web app calculate something on your machine instead of the server's? To leverage your memory and avoid a slow network call.
- Why does a site save data in Local Storage or IndexedDB? To use your local disk and avoid having to fetch that data over the network every time you visit.
When you're analyzing an application and see it storing a large amount of data in the browser, you now know the motive. The developer is making a deliberate choice to avoid the high cost of a network request. Understanding this logic helps you anticipate where to look for the most important forensic artifacts.
A Place for Everything: The Browser's Private Storage
Okay, so scripts can talk to servers, but what about storing data locally? As we mentioned, a script can't just save a file to your desktop. The sandbox prevents that. Instead, the browser gives the script several different ways to store information right inside your browser's profile directory. For an analyst, these storage locations are forensic gold mines.
- Cookies: The classic. Cookies are small pieces of data that a server asks the browser to hold onto. The browser then includes that cookie with every future request to that same server. They're most famously used for session tokens, which is why stealing them is a primary goal in attacks like session hijacking[7].
- Local Storage & Session Storage: These are simple "key-value" stores, like a little dictionary where a script can save bits of text. They are perfect for storing things like user settings, preferences, or even API keys and tokens. The key difference is persistence: Local Storage sticks around even after you close the browser, while Session Storage is wiped clean the moment you close the tab[8].
- IndexedDB: This is the heavy-duty option. IndexedDB is a full-blown database that lives inside the browser. If a web application needs to store a large amount of complex, structured data (like emails in a web client or notes in a productivity app), it will likely use this[9].
- Other Storage: You might also see other storage mechanisms in the developer tools, like Cache Storage for storing network request and response data, or Interest Groups, which are part of Google's Privacy Sandbox initiative for advertising. While less common for general forensic analysis, it's good to know they exist.
Peeking Under the Hood: The Developer Tools (F12)
This is all great in theory, but how do we actually see it in action? Every modern browser has a powerful built-in utility called the Developer Tools. You can usually open it by pressing F12. While it's made for developers, it's one of the most essential tools for any web security analyst[10].
There are many tabs, but you'll spend most of your time in three of them:
- Console: Think of this as the script's live output log. Developers print messages here to debug their code, and sometimes they forget to remove sensitive information. It's also where you'll see any errors the script is running into.

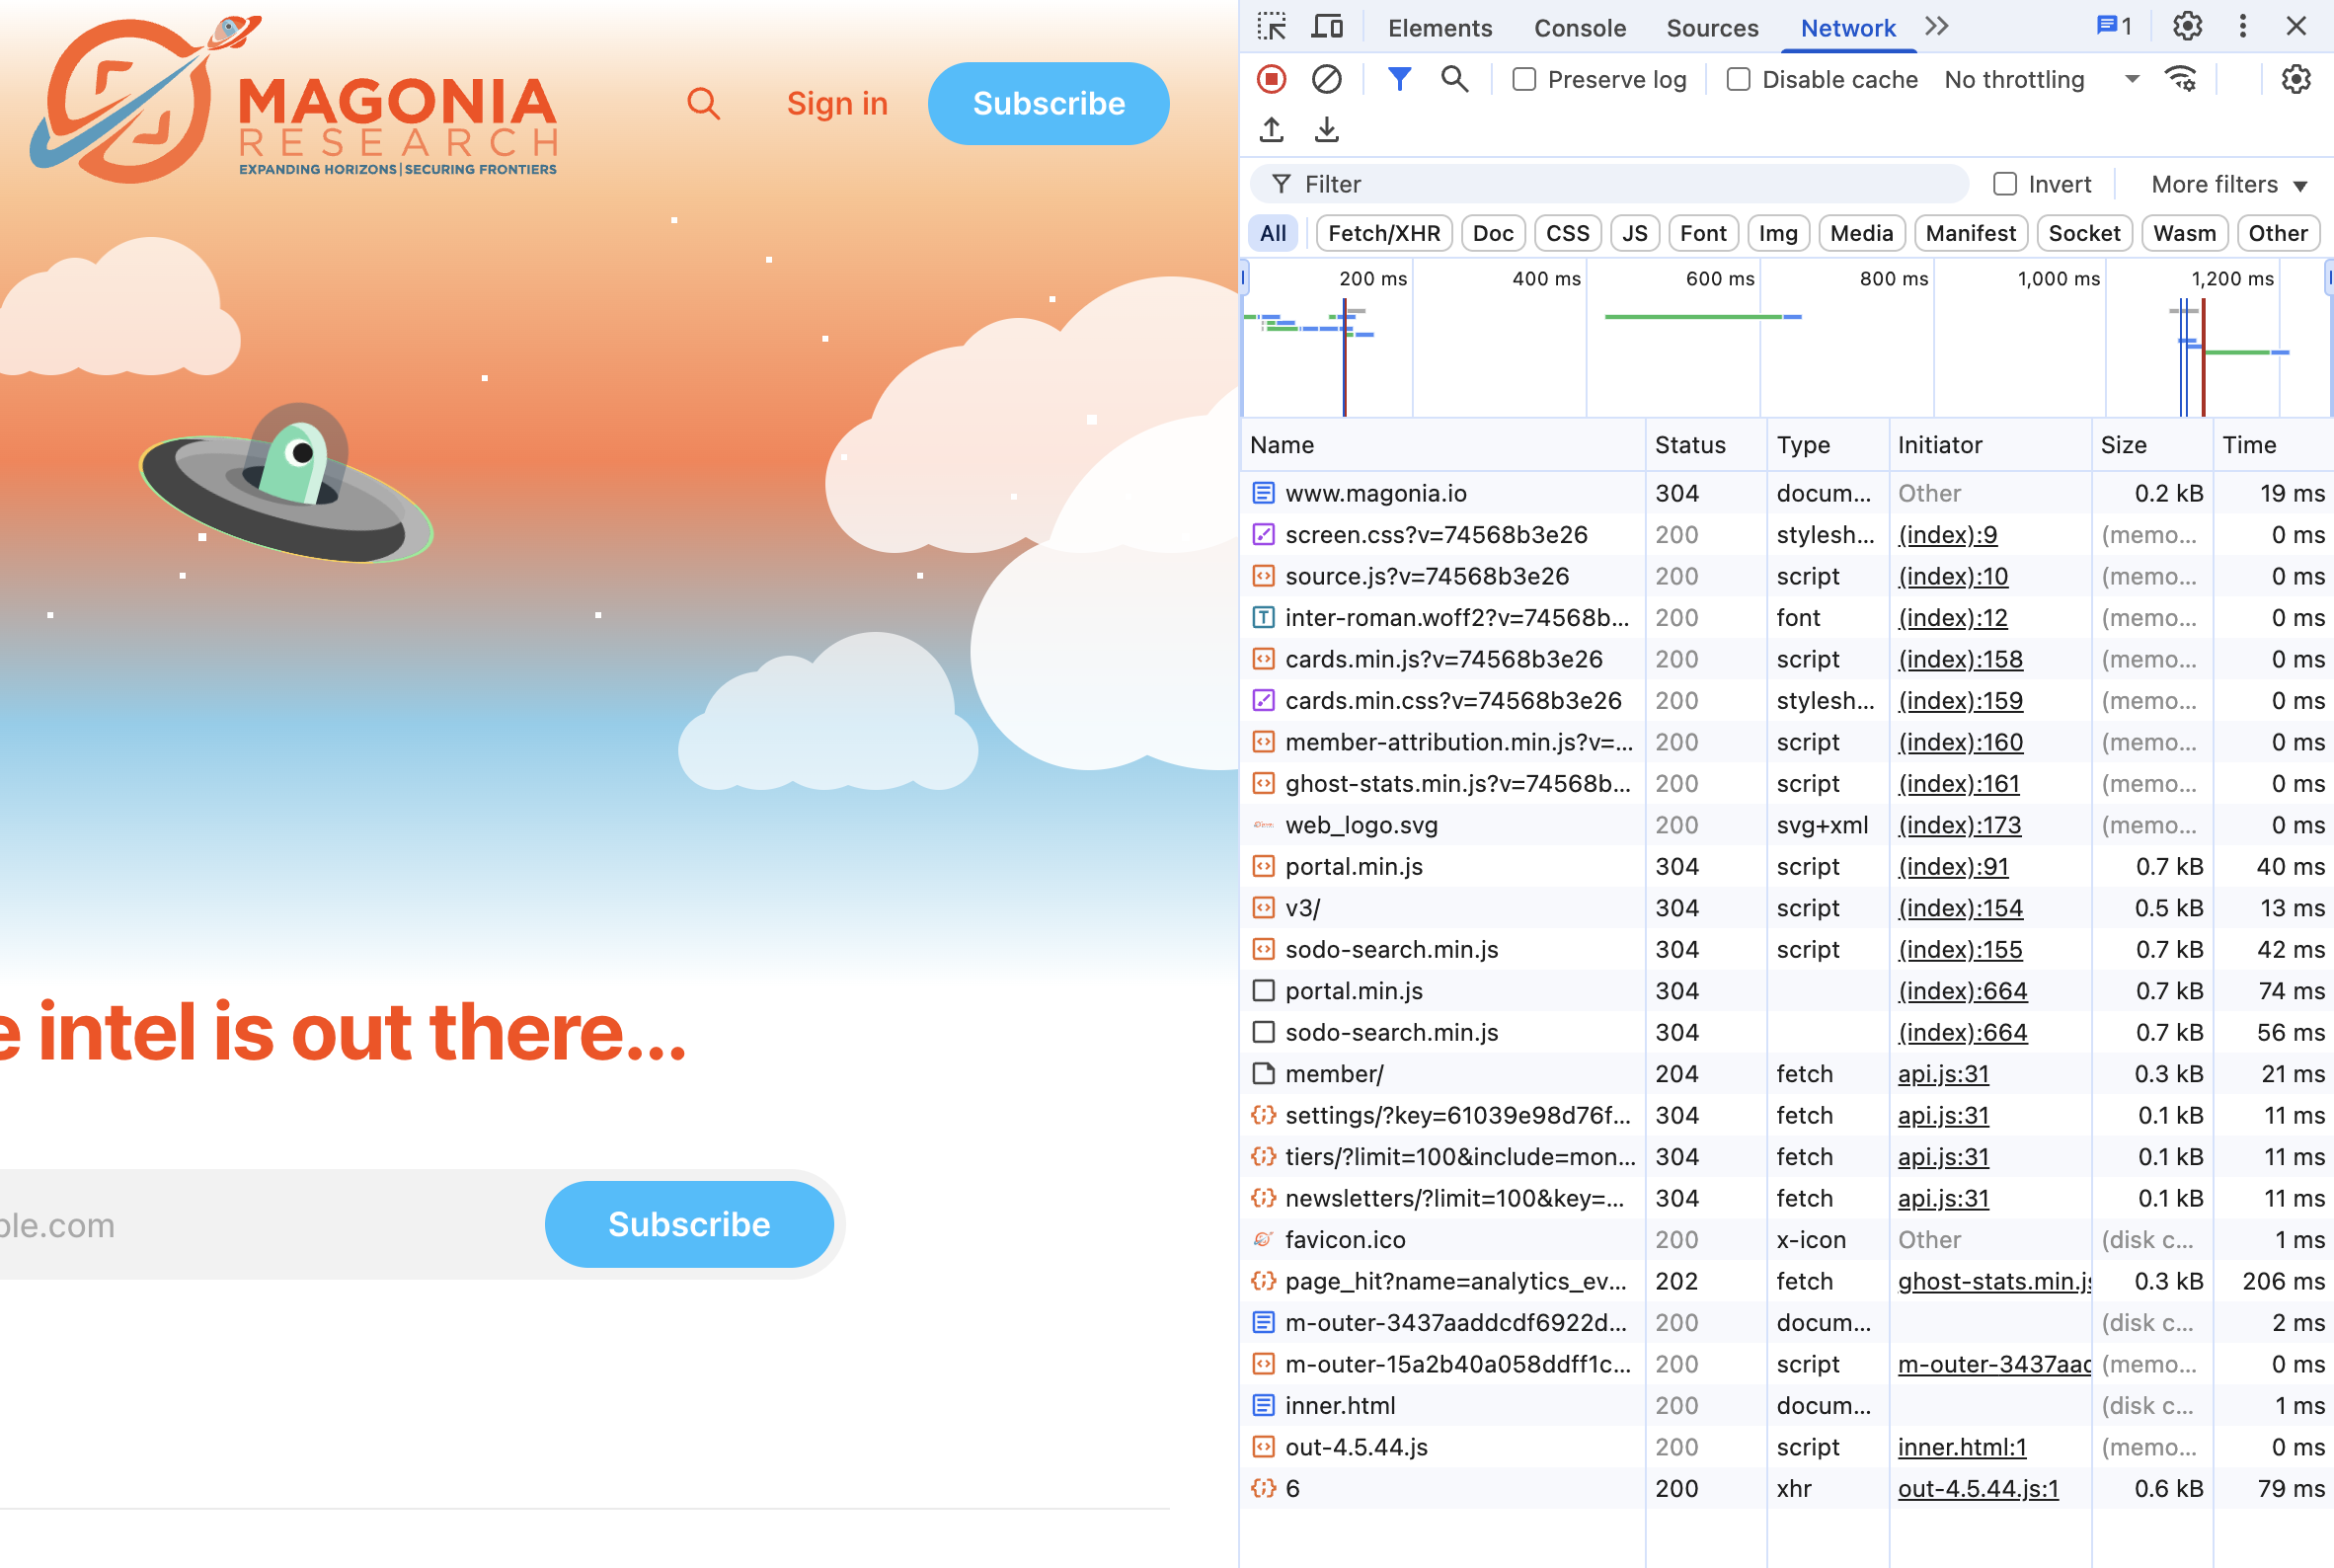
- Network: This is your personal wiretap for the browser tab. It records every single HTTP request the page makes, including all the
FetchandXHRcalls. You can click on any request to inspect the full headers, the data sent to the server, and the complete response it sent back. It’s the ground truth for what the application is communicating.
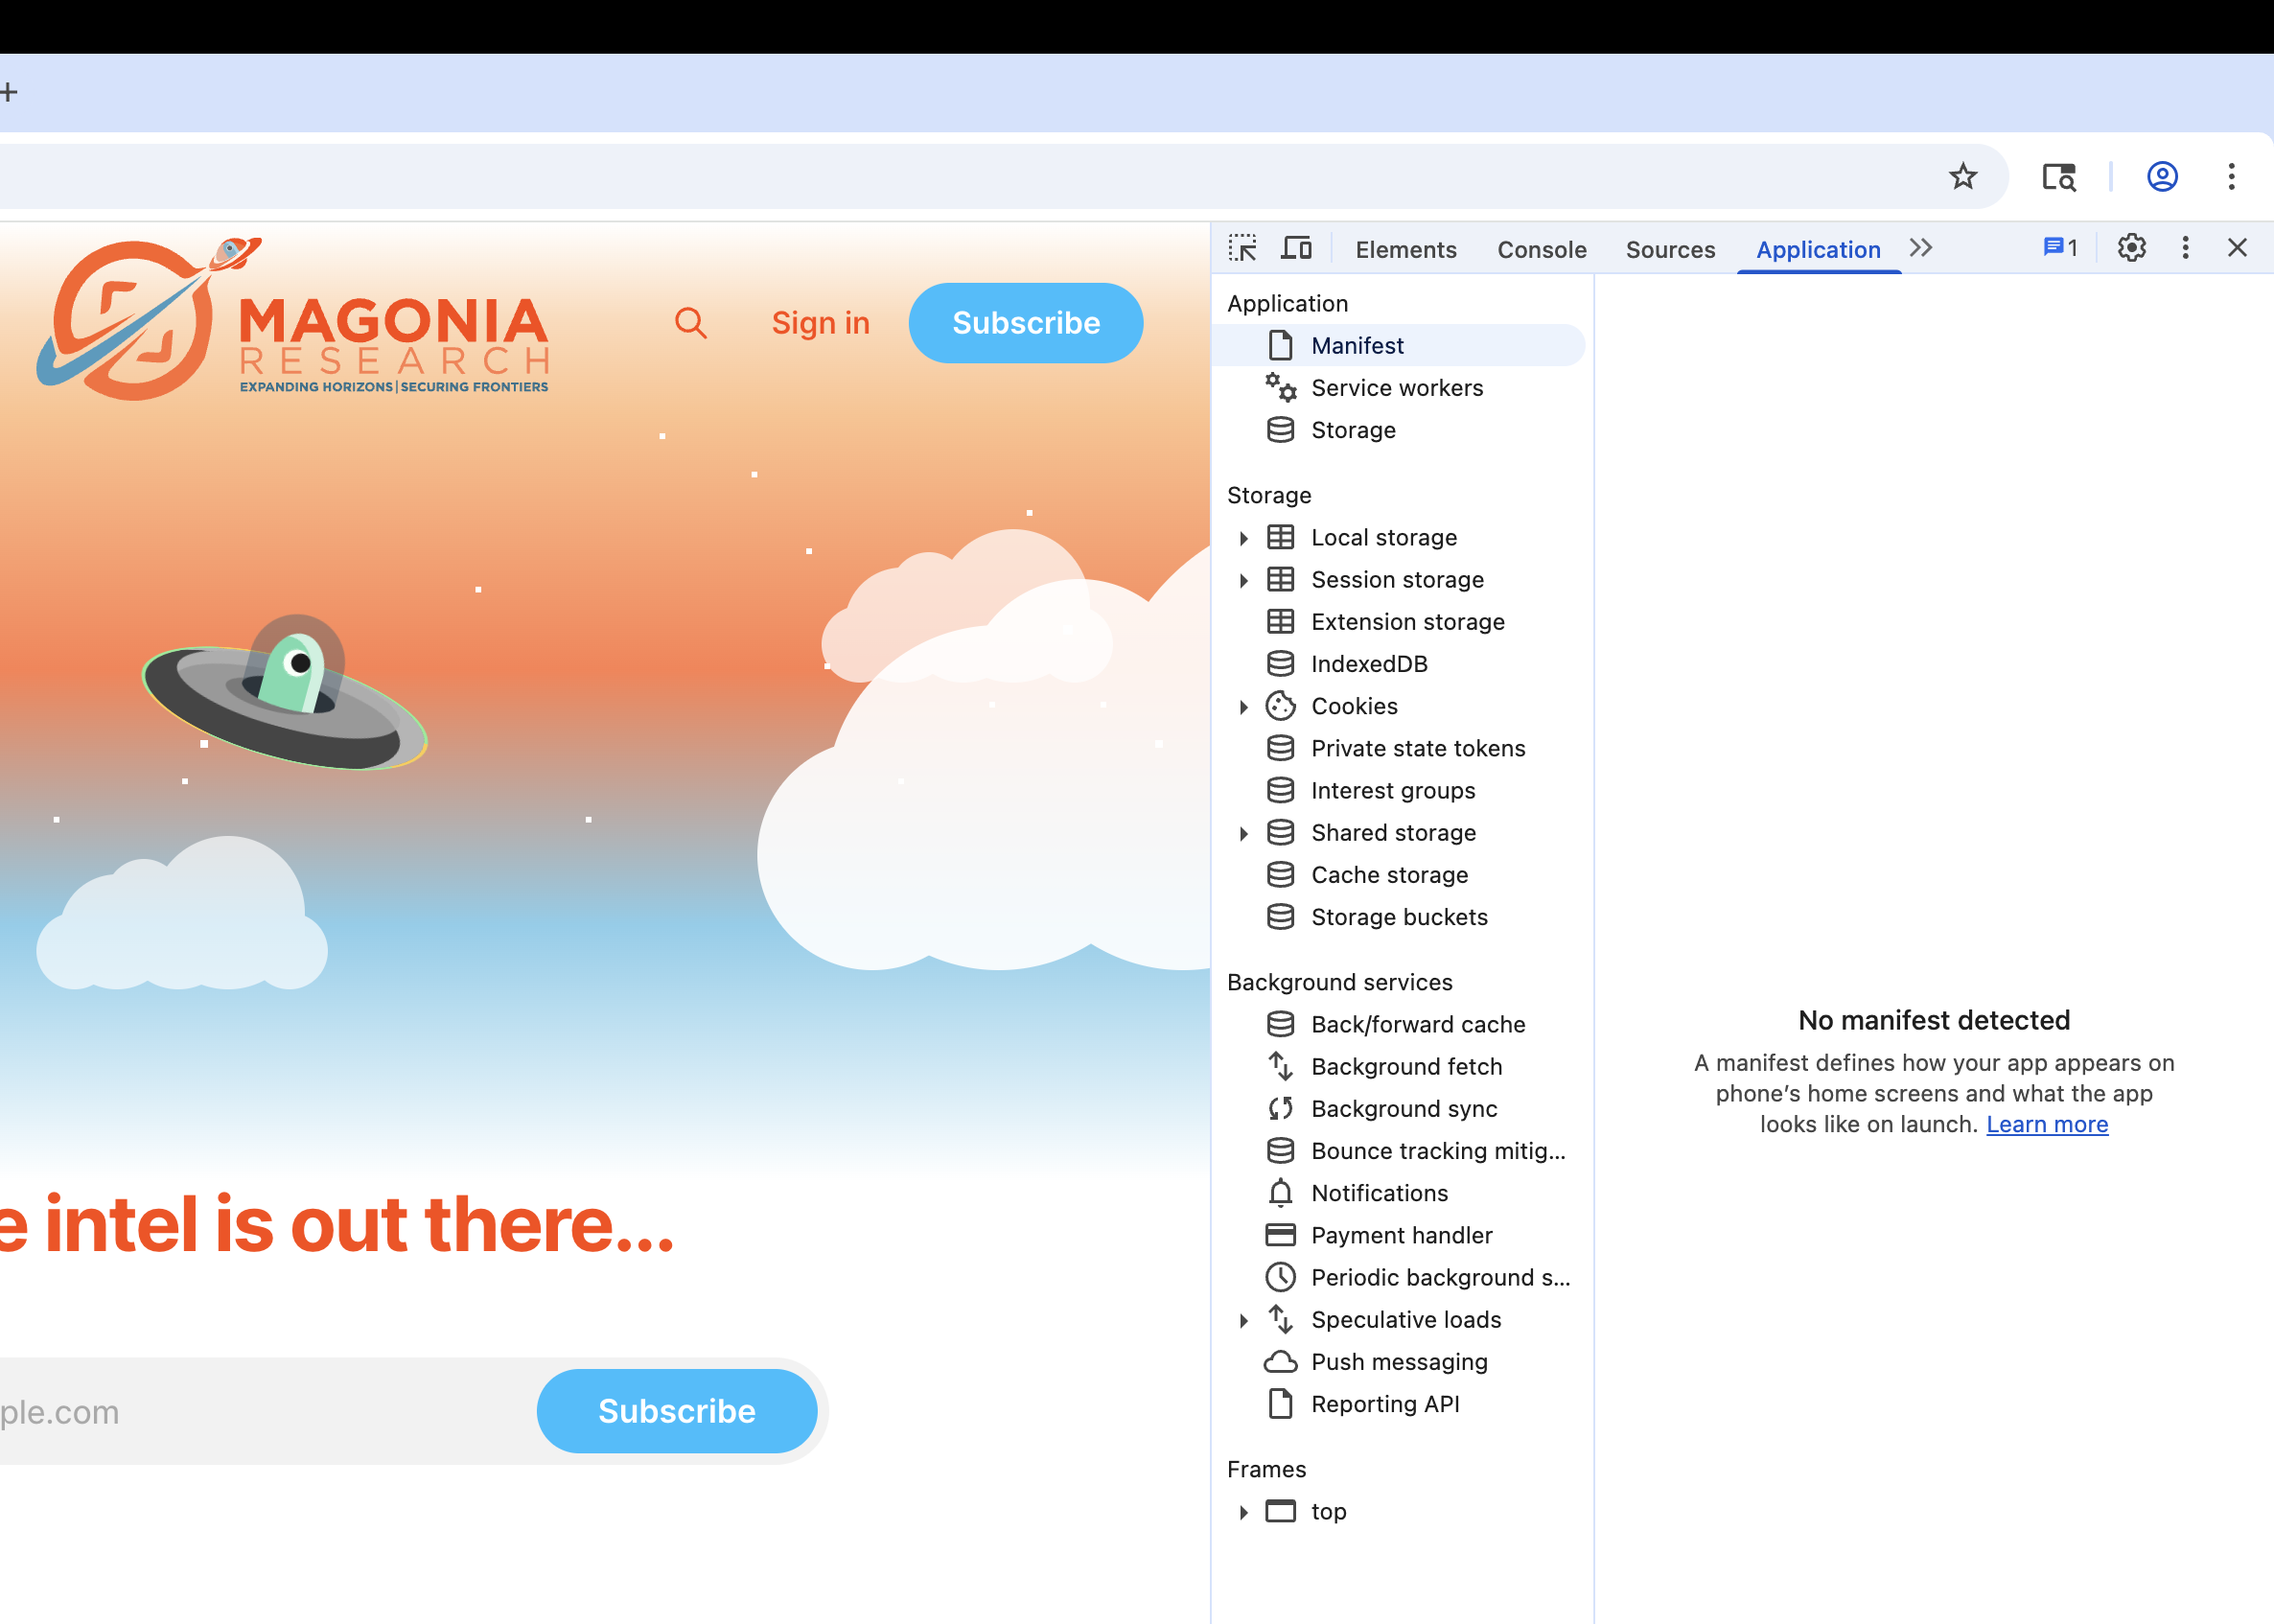
- Application (or Storage in Firefox): This is the file explorer for the browser's private storage. In this tab, you can directly browse the contents of the Cookies, Local Storage, and IndexedDB for the site you're on. You can see exactly what an application is saving about you and your session.
From Theory to Practice: Basic Browser Forensics
Now that we know how and why the browser stores data, we can pivot to the final question: where is it all kept? As an analyst, you need to know where to find the evidence on disk. Since the browser sandbox prevents applications from writing all over the file system, they store everything in predictable locations within the user's profile directory.
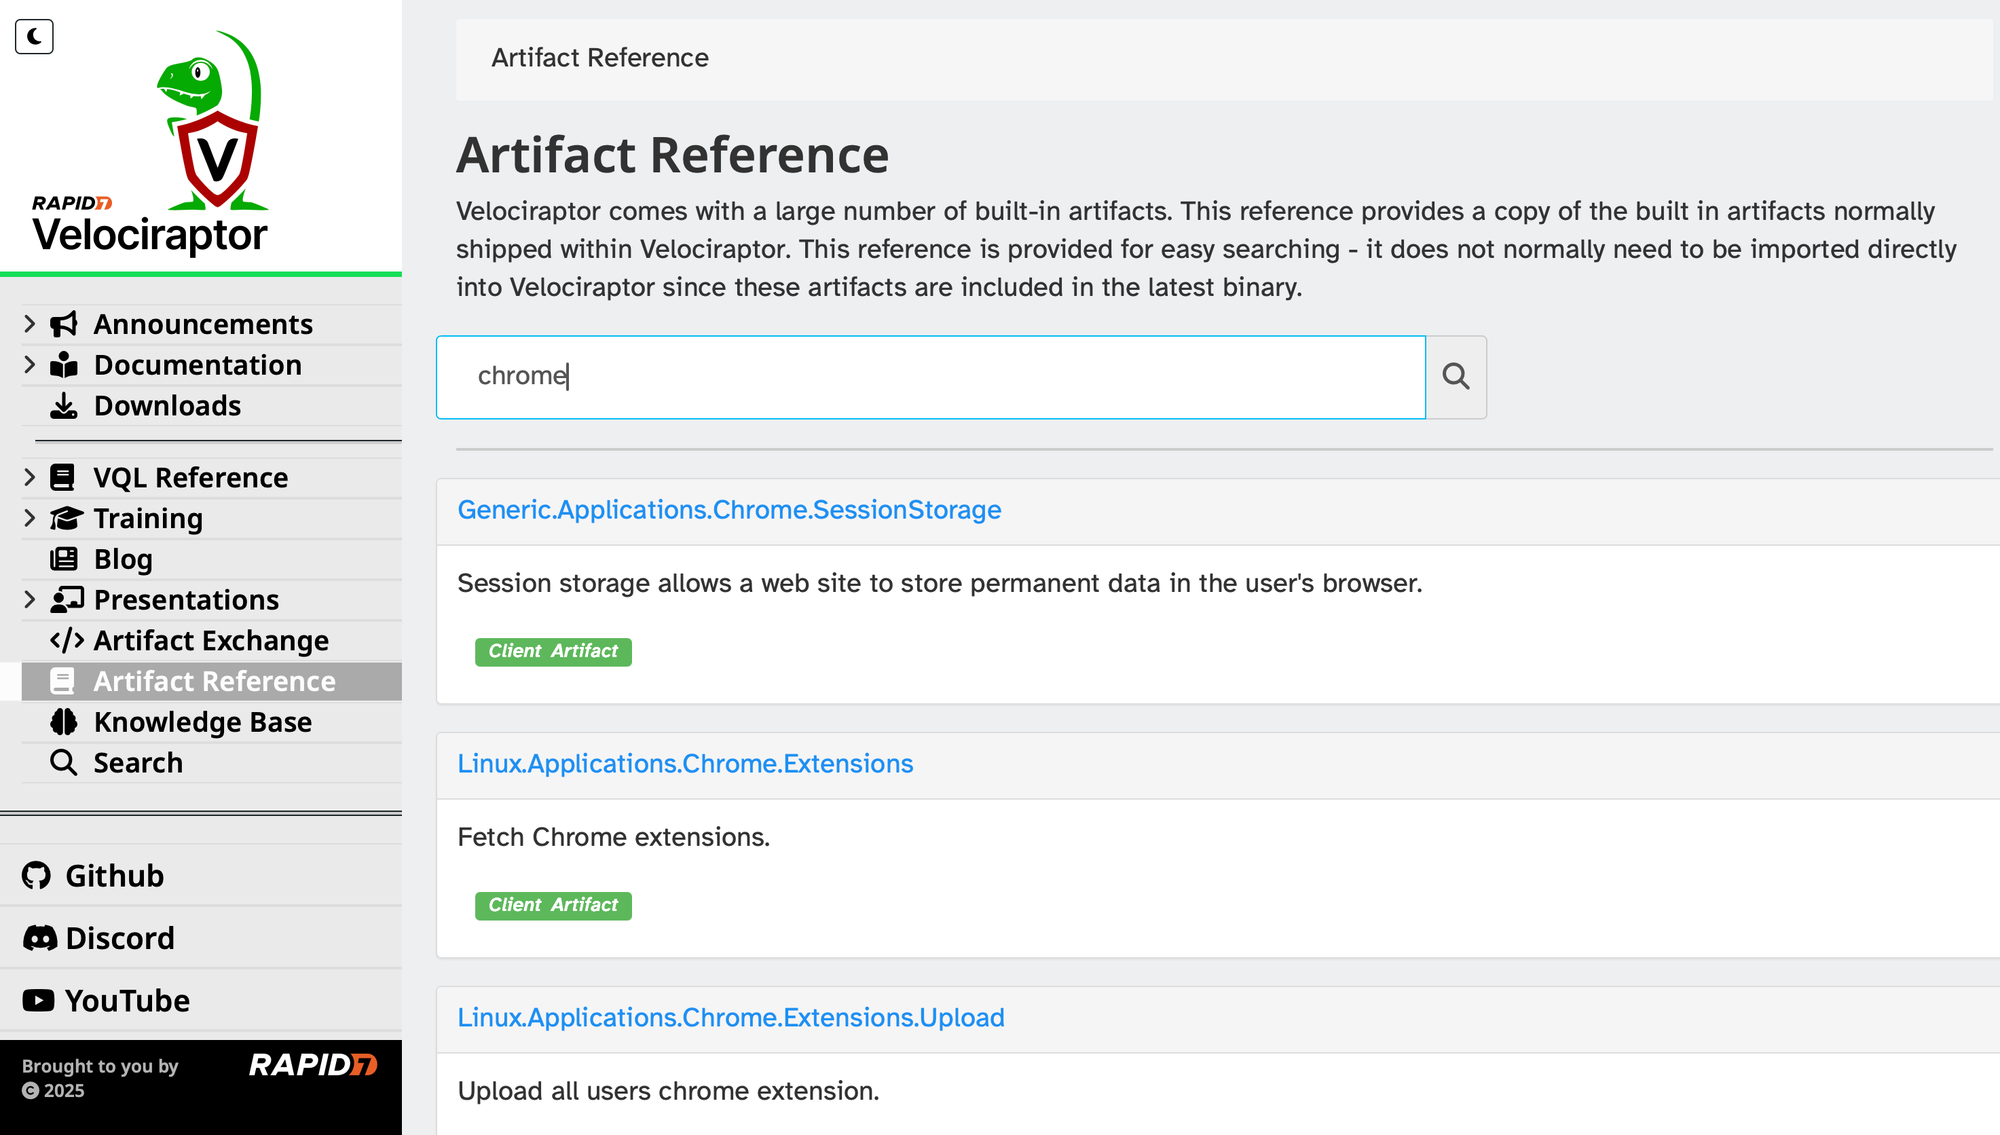
Fortunately, you don't always have to go digging for these files manually. Open-source DFIR (Digital Forensics and Incident Response) tools can make finding, collecting, and analyzing these artifacts much easier. A great example is Velociraptor, which has pre-built forensic artifacts specifically designed to parse browser history, cookies, session storage, and more from all major operating systems. Instead of manually navigating to these directories, you can run a Velociraptor "hunt" and have it automatically collect and structure the data for you.
Key Locations: Default Profile Paths
All of this browser data is stored in predictable locations within a user's profile directory. Below are the default paths for the major browsers[11][12]. Keep in mind that <user> is the user's profile name, and <profile> is a randomly generated string for a specific Firefox profile.
- Windows:
- macOS:
- Linux:
Key Files to Look For
Inside those profile directories, you'll find a treasure trove of information, much of it stored in SQLite database files[13]. This is a very common, lightweight, file-based database format.
For Chrome and Edge (and other Chromium-based browsers), look for these files[13:1]:
History: The user's browsing history, downloads, and search terms.Cookies: All the cookies stored by the browser.Login Data: Stored usernames and passwords. This data is encrypted.Web Data: Autofill information, including names, addresses, and credit card info (which is also encrypted).
For Firefox, the naming is a bit different:
places.sqlite: Contains browsing history, bookmarks, and downloads.cookies.sqlite: Stores the browser cookies.formhistory.sqlite: Holds saved form data for autofill.logins.jsonandkey4.db: Firefox stores saved credentials in this JSON file, which is encrypted using a key from thekey4.dbdatabase[14].
A quick note on SQLite: To view the contents of these .sqlite files, you can't just open them in a text editor. You'll need a dedicated tool like DB Browser for SQLite, which is free and works on all major operating systems[15].
Conclusion: Thinking Like a Developer
We've covered a lot, from how JavaScript runs inside a sandboxed browser environment to the performance hierarchy that dictates why developers make certain choices. We saw how those choices lead to applications storing data locally and how we can find those artifacts on disk.
The single most important takeaway is this: understanding the developer's motive makes you a more effective analyst.
When you know why an application is built a certain way, you can anticipate its behavior. You know why it's storing complex data in IndexedDB (to avoid slow network calls) and where to find the remnants of that activity (typically in a folder named IndexedDB within the profile path). You understand why session information is saved in Local Storage and can find its database files (often in the Local Storage\leveldb directory). You can predict what kind of evidence will exist before you even start looking. This shift in perspective, from just observing artifacts to understanding their origin, is what separates a good analyst from a great one.
Sources
Already have an account? Sign in
No spam, no sharing to third party. Only you and me.